Occupancy cost restaurant India — rent, CAM, electricity benchmarks by city
Occupancy cost in Indian restaurants — rent, CAM, electricity benchmarks by city tier, what to negotiate at lease signing, and how to keep occupancy in the green band.
Last updated 11 May 2026
About this piece. Occupancy cost is the most under-negotiated line on the Indian restaurant P&L. Rent gets the headline attention; CAM, electricity loading, common-area HVAC, and signage charges get signed without the same scrutiny. Once the lease is signed, this entire stack is fixed for the next 5–9 years. This piece sets out what occupancy cost actually includes, benchmarks by city tier, and what to negotiate while you still have leverage.
What "occupancy" actually includes
Operators almost always under-report occupancy because they only count rent. Full occupancy cost in an Indian restaurant lease is:
| Component | What it is | Where it hides |
|---|---|---|
| Base rent | Monthly rent on the leased area | The lease |
| CAM (Common Area Maintenance) | Maintenance of common areas in malls / commercial complexes | The CAM schedule |
| Property tax | Sometimes passed through; sometimes split | Lease boilerplate |
| Electricity | Energy cost on the meter assigned to the outlet | Utility bills |
| Common-area HVAC | Mall AC contribution charged separately | CAM schedule |
| Water | Often a flat per-month charge | CAM or separate meter |
| Diesel / DG backup | Per-unit charge for backup power | CAM or separate |
| Marketing / mall promo | Mandatory mall marketing levy | Schedule attached to lease |
| Signage charge | Mall / building-owner charge for signage rights | Often a separate annexure |
| Security deposit (interest forgone) | 3–9 months rent locked up | Implicit cost |
The benchmark below is all of the above, not just base rent.
Target band for total occupancy cost as % of net sales
Occupancy cost % = Total occupancy / Net sales (pre-GST, post-aggregator)
| Format | Occupancy target % | Comfortable band |
|---|---|---|
| QSR / cloud kitchen (back-lane) | 6 – 10% | up to 12% |
| QSR (high-street) | 10 – 14% | up to 16% |
| Casual dine (high-street) | 12 – 16% | up to 18% |
| Casual dine (mall) | 14 – 20% | up to 22% |
| Fine dine | 10 – 16% | up to 18% |
| Bar / pub | 10 – 16% | up to 18% |
Occupancy above 22% of net sales is a structural problem that no amount of menu engineering or labour optimisation solves. The fix has to be at the lease — renegotiation at renewal, sublet of unused area, or relocation.
Rent benchmarks by city tier — the broad shape
Rent in Indian Tier-1 commercial real estate is quoted per sq ft per month (carpet or built-up — confirm which in the lease). The bands below are indicative ranges from operator conversations and broker market reports — confirm with a local broker before budgeting.
| City | High-street prime (₹/sq ft/month) | Tier-A mall (₹/sq ft/month) | Off-prime / back-lane |
|---|---|---|---|
| Mumbai (BKC, Lower Parel) | 350 – 600 | 450 – 750 | 150 – 250 |
| Delhi NCR (CP, Khan Mkt, GK, Saket malls) | 250 – 500 | 350 – 600 | 100 – 200 |
| Bengaluru (Indiranagar, Koramangala, mall) | 200 – 450 | 300 – 550 | 80 – 180 |
| Pune (Koregaon Park, Camp, mall) | 150 – 350 | 250 – 450 | 70 – 150 |
| Hyderabad (Banjara Hills, Jubilee Hills, mall) | 150 – 350 | 250 – 450 | 70 – 150 |
| Chennai (Nungambakkam, Anna Nagar, mall) | 150 – 350 | 250 – 450 | 70 – 150 |
| Tier-2 capitals (Lucknow, Jaipur, Indore, Bhopal) | 80 – 200 | 150 – 300 | 40 – 100 |
For a 1,500 sq ft outlet in an NCR Tier-A mall at ₹450/sq ft/month, base rent alone is 1,500 × 450 = ₹6,75,000/month. Add CAM at ₹120/sq ft = ₹1,80,000, common HVAC at ₹40/sq ft = ₹60,000, marketing levy at ₹15/sq ft = ₹22,500, and you're at ₹9,37,500/month before electricity.

CAM — the silent cost line
CAM (Common Area Maintenance) is where most of the post-signing cost surprise lives. Typical CAM components in a Tier-A Indian mall:
| CAM component | Indicative range (₹/sq ft/month) |
|---|---|
| Common area cleaning + housekeeping | 15 – 25 |
| Common-area lighting + utilities | 10 – 20 |
| Security | 15 – 30 |
| Common HVAC (chiller plant) | 30 – 60 |
| Lifts + escalators + plumbing | 8 – 15 |
| Building-owner admin + insurance | 10 – 20 |
| Marketing / promotional levy | 10 – 20 |
| Total CAM (Tier-A mall) | 100 – 180 |
For high-street outlets, CAM is usually nil or much lower (₹10–₹30/sq ft for cleaning + security in a small commercial complex).
The two questions to ask before signing a CAM-heavy lease:
- Is CAM fixed (₹X/sq ft/month, escalation defined) or actual (your share of actual costs incurred, billed quarterly)? Fixed is preferable — it caps your downside.
- What is the CAM escalation clause? An open-ended escalation linked to "actual costs" is dangerous. A fixed annual escalation of 5–8% is acceptable.
Electricity — load assessment matters more than tariff
Electricity is usually the second-largest occupancy line after rent + CAM. Two operator mistakes:
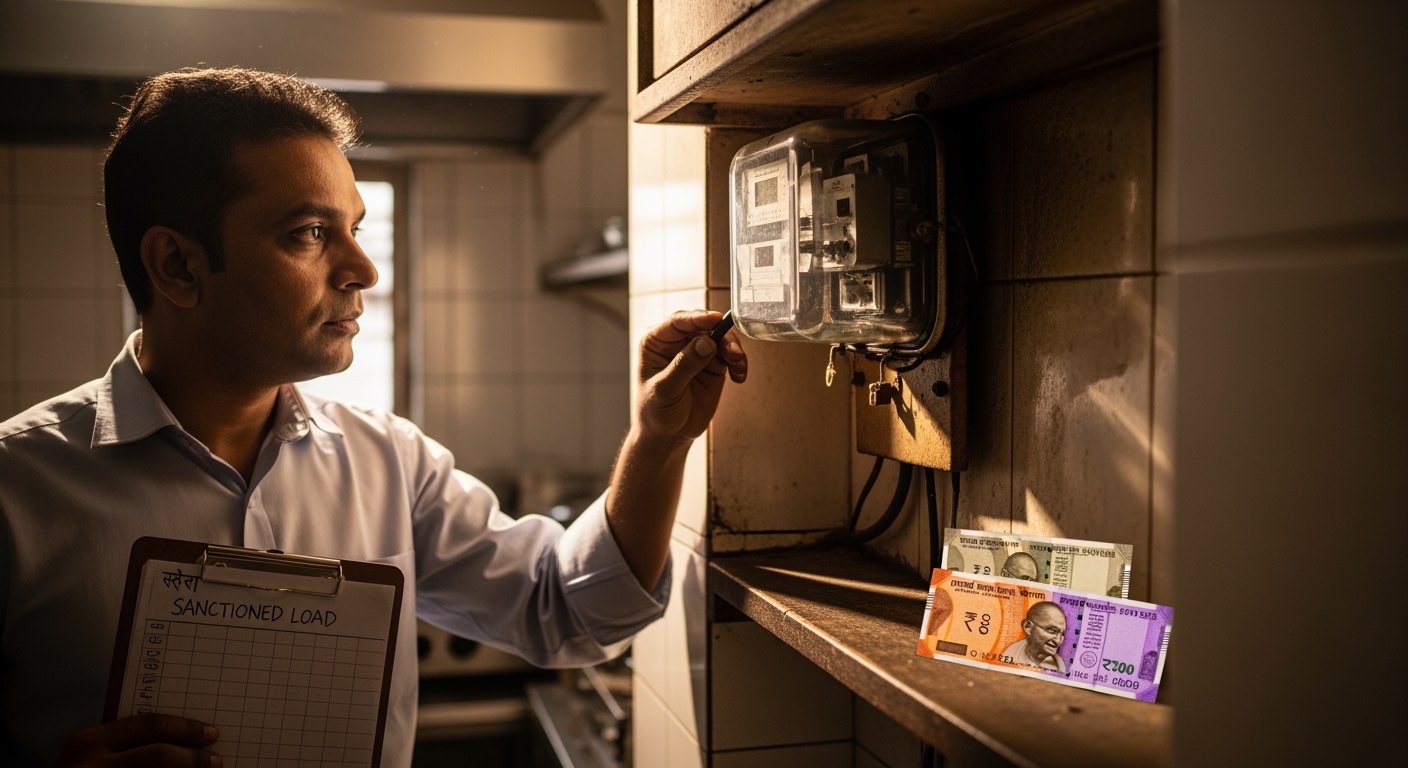
- Over-sanctioning load. A 1,500 sq ft casual-dine outlet usually needs 35–50 kVA sanctioned load (kitchen + AC + lighting). Sanctioning 75 kVA "for safety" leaves you paying fixed-charge component on the surplus capacity for the life of the lease.
- Under-counting common-area HVAC. In a mall, the chiller-plant cost is on the CAM schedule, but the fan-coil unit running inside your outlet is on your meter. Both add up.
Indicative monthly electricity bill bands for a 1,500 sq ft outlet at typical Tier-1 commercial tariff:
| Outlet type | Sanctioned load | Monthly bill (₹) |
|---|---|---|
| QSR (low kitchen heat, no AC) | 20 – 30 kVA | 35,000 – 60,000 |
| Casual dine (full kitchen + AC) | 35 – 50 kVA | 80,000 – 1,40,000 |
| Fine dine (heavy kitchen + AC) | 60 – 80 kVA | 1,30,000 – 2,20,000 |
Bar / pub outlets vary widely depending on chiller capacity and ice machine load.
What to negotiate at lease signing — the 10-item list
You have leverage once in the lease lifecycle — at signing. Use it for:
- Rent-free fitout period — typically 30–90 days. Each month free at ₹6.75 lakhs is real money.
- Phased rent escalation — instead of annual 8% from year 1, negotiate 5% in years 1–2, 8% in years 3–4, 10% from year 5.
- CAM cap — fixed CAM with capped escalation, not actuals.
- Security deposit at 3 months, not 6 — every additional month is locked working capital.
- Sub-letting / assignment rights — gives you exit optionality if the outlet underperforms.
- Exclusivity clause in malls — no competing format within a defined radius / floor.
- Force majeure / business interruption clause — covers pandemic-style closures and licence withdrawal.
- Signage rights — included in base rent, not charged separately.
- Sanctioned-load specification — tied to your kitchen plan, not over-sanctioned.
- Renewal clause with rent reset capped at market — open-ended renewal escalations are the most common operator regret in year 6.
Sign the lease without these and you're optimising prime cost forever to compensate for a structural occupancy overhead. The lease negotiation is a 60-day project worth ₹50–₹150 lakhs of NPV over a 9-year lease.
Renegotiation at renewal — the underused lever
Most leases come up for renewal in years 5–9. The renewal is the second leverage moment. Use it for:
- CAM and electricity audit — pull the last 36 months of CAM bills and contest unsupported escalations.
- Rent reset to current market — get two independent broker valuations. The landlord's "market" claim is usually 15–25% above actual market.
- Term extension at preferential rate — if you're a strong tenant, a 9-year extension at year-1 rate + indexed escalation can be cheaper than a 5-year renewal at higher current rate.
- Recompense for overpayment — if CAM was billed on actuals and the landlord can't substantiate the historical bills, recompense is negotiable.
A composite multi-outlet operator we've spoken to recovered roughly 6 months of overpaid CAM at a Bengaluru mall renewal by demanding documented CAM bills for the prior 36 months.
How occupancy interacts with the rest of unit economics
Occupancy is the largest fixed cost on the P&L. That makes it the dominant driver of breakeven. A 1-point reduction in occupancy % typically lowers breakeven by 1.5–2 cover counts per day on a casual-dine outlet. Conversely, a 1-point creep in occupancy % over a 5-year lease (typical CAM drift) raises breakeven by the same.
The lever you can pull post-lease is small — sub-meter the kitchen vs front-of-house electricity, audit the CAM bill quarterly, switch to LED lighting, run the kitchen exhaust on variable speed. These cumulatively recover 0.5–1 point of occupancy %, not more.
The big lever — the lease itself — is signed once and lived with for years.
Common occupancy mistakes
- Choosing a Tier-A mall location for a format that doesn't need footfall. A cloud-kitchen or back-lane QSR doesn't need ₹450/sq ft footfall — it needs ₹120/sq ft delivery proximity.
- Over-sizing the outlet. Every extra 200 sq ft is ~₹1.5 lakhs/month of occupancy. Size to peak cover count + 15%, not "for future growth".
- Signing without an electricity load audit. A retrofit to upsize sanctioned load post-signing is expensive and slow.
- Treating signage charges as petty. ₹50,000–₹1,00,000 / month of signage charges across a multi-outlet portfolio is a significant line.
- Forgetting the security deposit interest cost. ₹40 lakhs of security deposit at 8% opportunity cost is ₹3.2 lakhs / year of invisible occupancy expense.
What to do this quarter
If you're in an existing lease:
- Pull the lease and CAM schedule. Print both.
- Calculate full occupancy cost % for the last 6 months.
- If you're above the format's comfortable band, list the three largest occupancy lines and identify which are fixed vs negotiable at next renewal.
- Add a calendar reminder for 12 months before renewal — that's when serious renegotiation prep starts.
If you're about to sign a lease:
- Run unit economics for the proposed outlet using the rent + CAM in the proposed lease.
- Compute breakeven cover count and check it's below your realistic peak.
- Negotiate the 10-item list above. Don't sign without items 1, 2, 3, 5, and 10.
Occupancy is a 9-year decision in a 1-week window. Treat it accordingly.
Related on Restaurant Daily
One operator playbook a week, in your inbox.
Cash close, petty cash, payroll, compliance, unit economics — sent every Monday morning. No spam, no upsell drip. Unsubscribe in one click.
Sent from noreply@restaurantdaily.ai. We never share your address.
Related reading
COGS vs prime cost restaurant India — what each tells you and how to track both
COGS vs prime cost for Indian restaurants — what each metric tells you, the formulas, when each one is the right number to act on, and how to track both monthly.
Menu engineering matrix for Indian restaurants — Stars, Plowhorses, Puzzles, Dogs
Menu engineering for Indian restaurants — Stars, Plowhorses, Puzzles, Dogs explained with a free template, worked example, and an action playbook for each quadrant.
Restaurant unit economics India — the full guide from prime cost to payback
Restaurant unit economics India — the full guide from prime cost and breakeven to four-wall EBITDA, contribution per cover, and payback period, with worked examples in INR.
Restaurant labour cost percentage India — benchmarks + how to bring it down
Restaurant labour cost percentage benchmarks for India by format, what to include in the number, and a 6-step playbook to bring it down without losing service quality.
Restaurant breakeven analysis India — formula, worked example, calculator
Restaurant breakeven analysis for India — the contribution-margin formula, a worked example in INR, breakeven cover counts by format, and a step-by-step calculator.