Bakery daily wastage tracking — SKU-level template + how to act on the data
Bakery daily wastage tracking for Indian bakeries — SKU-level Excel template, the four wastage categories, and the weekly review that turns the log into action.
Last updated 12 May 2026
About this piece. A bakery is a forecasting business disguised as a baking business. You produce in the morning what you think you'll sell by evening; whatever doesn't sell either gets binned, marked-down, or staff-meal'd. A bakery without a daily wastage log is a bakery flying blind on its single biggest controllable cost. This piece gives you the SKU-level wastage template, the four categories every entry must fall into, and the weekly review that converts log entries into production-plan changes.
Why bakeries need a wastage log more than any other restaurant format
Three reasons:
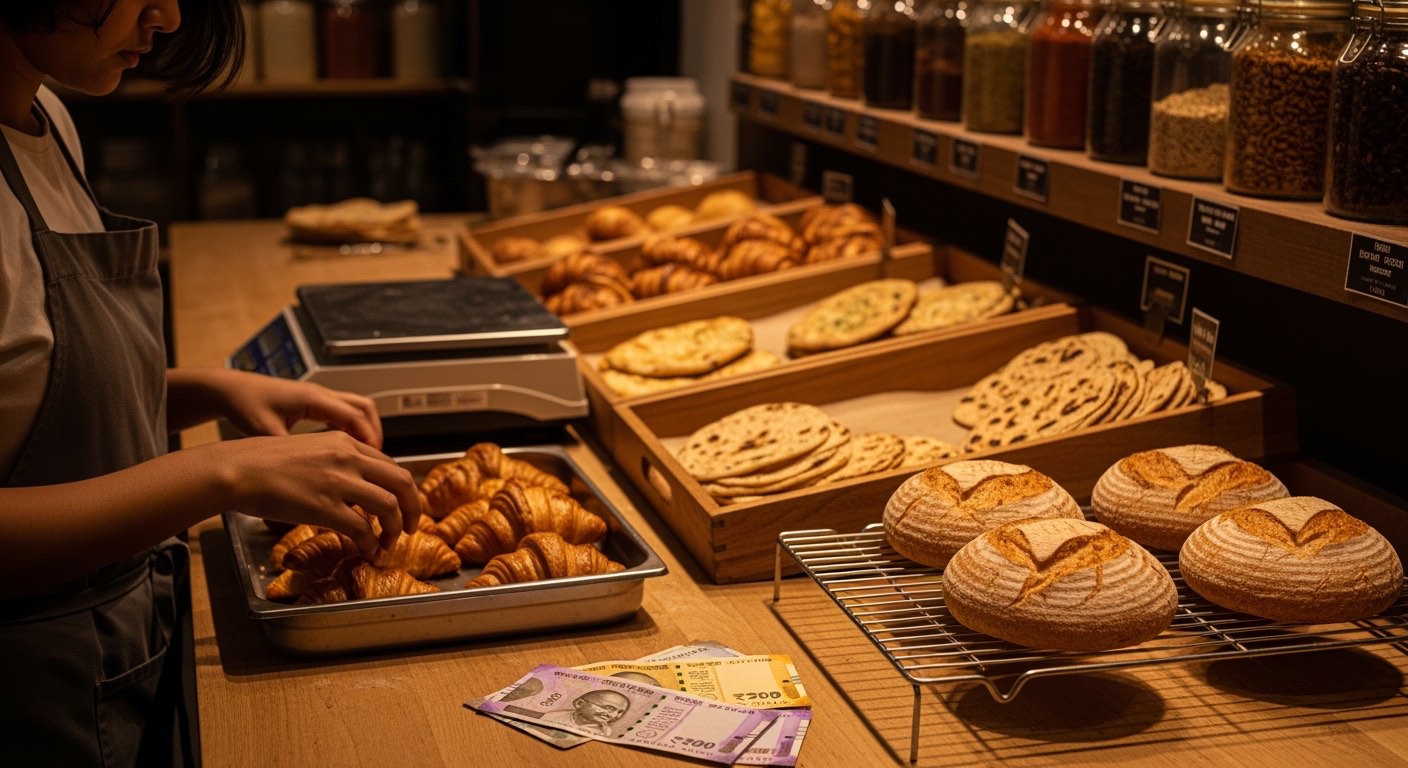
- No second life for unsold product. A QSR's unsold dosa batter becomes tomorrow's batter. A bakery's unsold croissant becomes tomorrow's bin liner. Once produced, the clock is real.
- Production decisions are made 6–12 hours before sales happen. You can't course-correct mid-shift. The only feedback loop is the daily wastage log → tomorrow's production sheet.
- High labour content. A ₹120 sourdough has ₹18 ingredient cost and ₹40 labour cost embedded. Throwing it away wastes the labour, not just the flour. Wastage % at a bakery is more painful than at a kitchen.
Public benchmark: well-run Indian artisanal bakeries operate at 4–7% production wastage. Bakeries without a daily log routinely run 14–22%. The 10-point gap is recoverable only through the data → production-plan loop, not through "telling the team to be careful".
The four wastage categories
Every wastage entry must fall into one of these four buckets — no "miscellaneous":
| Category | Example | What the data tells you |
|---|---|---|
| Production over-run | Baked 30 croissants, sold 22, binned 8 | Forecast was wrong; production sheet too high |
| Quality reject | 3 loaves under-proofed; not sellable | Process or ingredient issue; investigate |
| Display damage | 2 cakes dropped in transfer to display | Handling issue; trainable |
| Markdown / staff meal | 4 muffins marked-down at 6pm and unsold; given as staff meal | Pricing or timing issue; analyse |
Markdown that did sell is not wastage — it's revenue at lower margin. Track it separately as "discount sales".
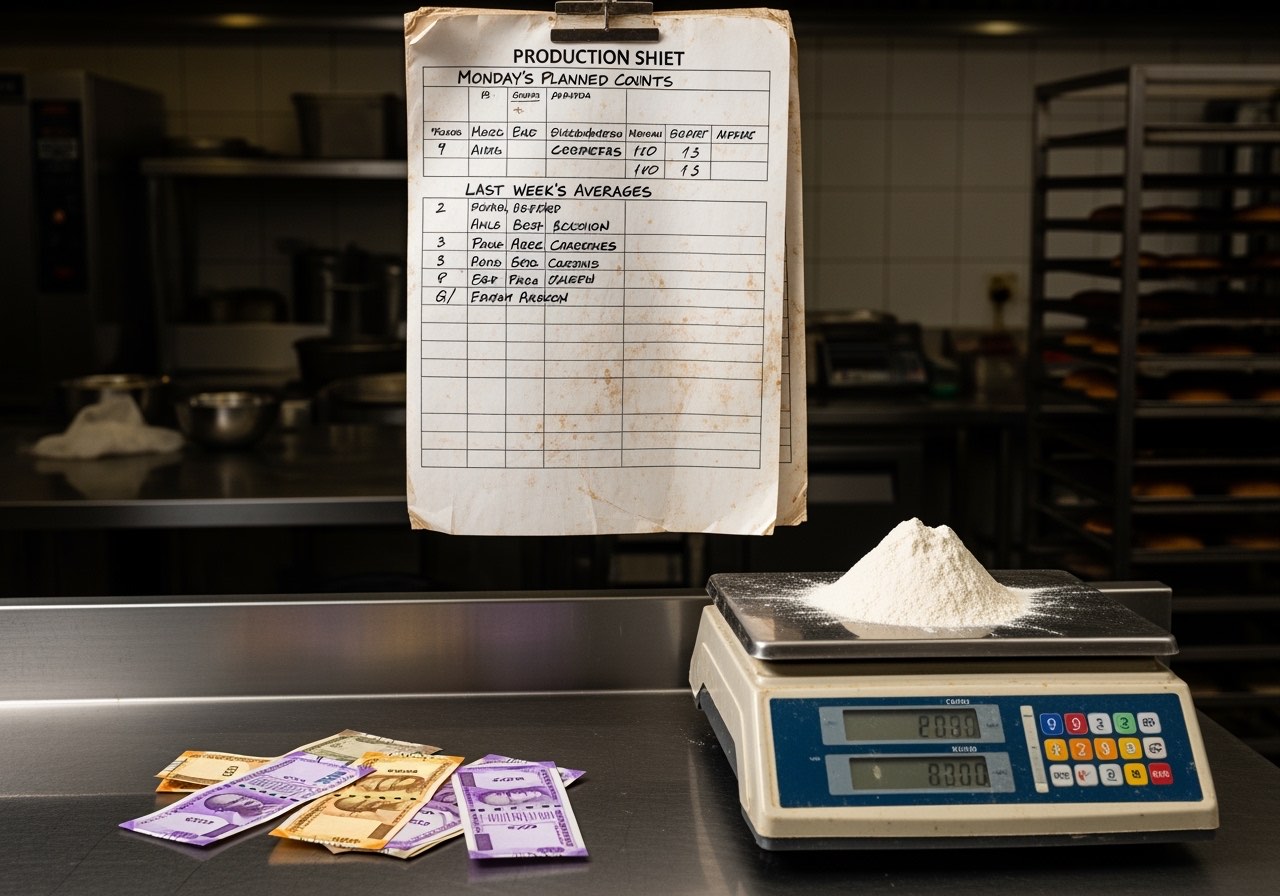
The daily wastage log — what's in it
Per SKU per day:
| # | Field | Source |
|---|---|---|
| 1 | Date | DD/MM/YYYY |
| 2 | SKU + variant | Master list |
| 3 | Produced (units) | Production sheet |
| 4 | Sold (units) | POS |
| 5 | Marked-down sold (units) | POS (separate code) |
| 6 | Wasted (units) | Physical close-of-day count |
| 7 | Wastage category | Drop-down (4 options above) |
| 8 | Wastage value (₹, at cost) | Auto: 6 × cost per unit |
| 9 | Wastage % | Auto: 6 / 3 × 100 |
| 10 | 1-line note | Free text |
Column 6 must reconcile: Produced = Sold + Marked-down sold + Wasted + Carried forward (rare; only for shelf-stable items). If it doesn't, something is unrecorded — likely a staff meal not logged or a comp.
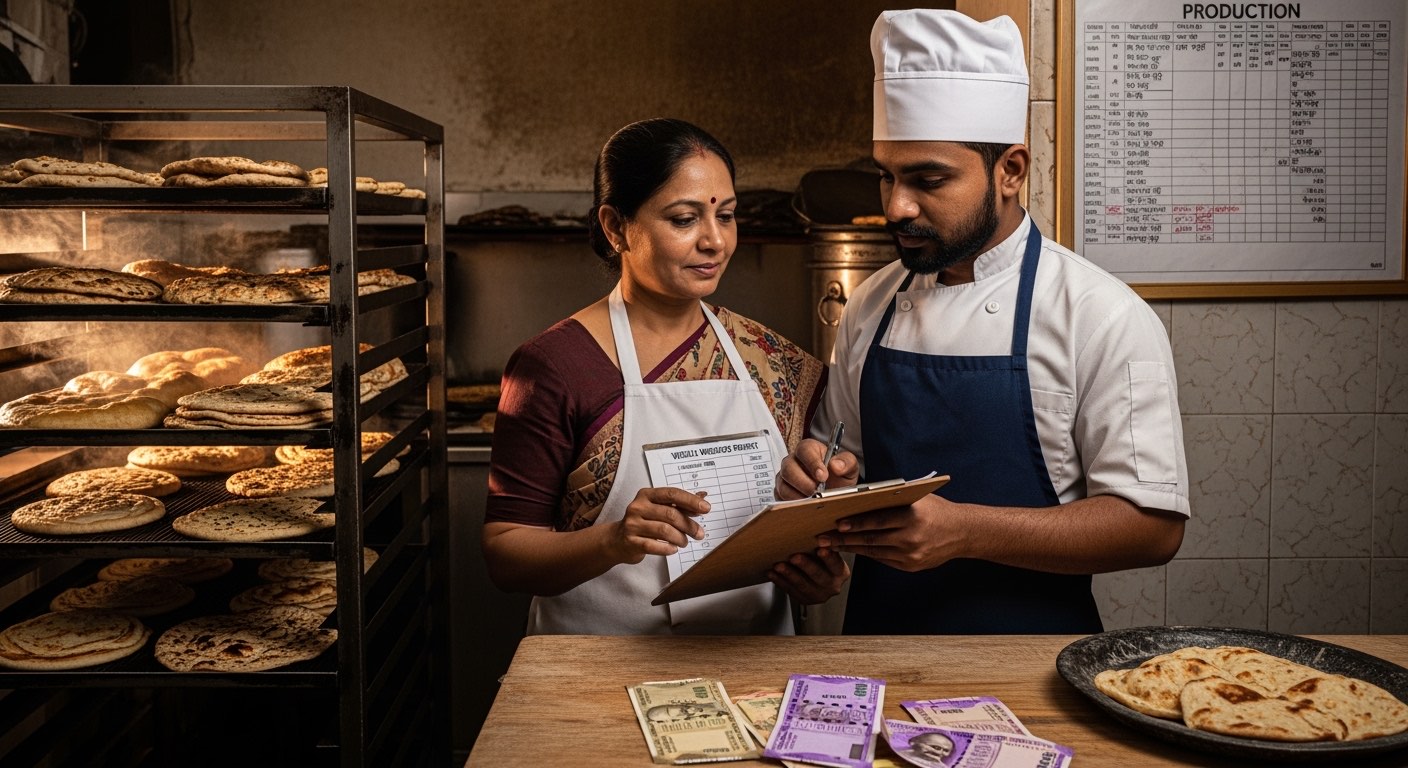
The closing ritual — 8:30pm to 9:00pm
| Time | Task | Owner |
|---|---|---|
| 8:30 | Last call on display; markdown stickers (50% off, 30 min window) on perishables | Counter |
| 8:50 | Markdown sales pushed; remaining unsold counted | Counter |
| 8:55 | Wasted units sorted into 4 categories — production over-run / quality / display / staff-meal-given | Baker + counter |
| 8:58 | Log filled, value calculated; baker + counter both sign | Both |
| 9:00 | Wastage tray photographed (timestamp); waste binned; staff meal portion plated | Baker |
The photograph is the part most owners skip. It's worth 10 minutes a week of review time. Patterns the spreadsheet won't show — "the wastage is always croissants on Wednesdays" — show in 8 weeks of photos quickly.
Weekly review — Sunday evening, 30 minutes
This is where the log becomes action. Open the log for the past 7 days; do four things:
1. Top 5 SKUs by absolute wastage value
Ranked by ₹, not units. The croissant at ₹35 cost wasted 8/day is the same problem as 1 cake at ₹280 cost wasted 1/day — but the chart will tell you which is recurring vs which is a single bad day.
2. Wastage % per SKU vs target
Set a target wastage % per SKU type:
| SKU type | Target wastage % |
|---|---|
| Sourdough loaves (24-hr shelf) | 5–8% |
| Croissants / viennoiserie | 6–10% |
| Cakes (custom + display) | 3–5% |
| Cookies / shelf-stable | 1–3% |
| Sandwiches (assembled) | 8–12% |
SKU running 2× target for 2 weeks straight = production cut next week. SKU running below target consistently = potential under-production (lost sales) — increase 10%, watch.
3. Wastage by category mix
If 70% of wastage is "production over-run" → forecast issue, fix the production sheet. If 30%+ is "quality reject" → process audit (proofing temperature, ingredient consistency). If display damage > 5% → handling training.
4. Action list for next week
Three production-sheet changes max. Don't try to fix everything in one week. Pick the biggest absolute-₹ leak and address it.
Sample weekly action list:
1. Croissant production: reduce from 30 to 24 (last 14 days avg sold = 22)
2. Chocolate cake: try Tuesday batch only; current 3-day production has 40% wastage
3. Quality reject investigation: under-proofed sourdough 2x this week — check proofer thermostat
The production sheet — the other half of the loop
The wastage log is feedback; the production sheet is the lever. A production sheet has:
- SKU + planned production qty
- Trigger time (e.g. dough mix at 4am, oven at 6am)
- Responsible baker
- Carry-over note from previous day's wastage log
The discipline is: Sunday's review changes Monday's production sheet, not next month's. Same-week feedback is the entire point of daily logging.
Three mistakes bakeries make with wastage logs
1. Logging without acting
Most bakeries that log don't review. The log becomes a guilt diary. Schedule the Sunday review on the calendar; treat it like a meeting.
2. Treating staff meals as "free"
Staff meals are a real cost. If a bakery gives away ₹400/day in staff meals, that's ₹12,000/month — material on a small bakery's P&L. Either budget it as staff welfare (capped, e.g. ₹150/staff/day) or count it as wastage. Don't pretend it's neither.
3. Pricing markdown wrong
A 50% markdown sticker at 8:30pm is too late if sale window is until 9pm. Markdown timing should be tested — 7:30pm 30%, 8:30pm 50%. The right window is the one where the marked-down item actually sells in a meaningful proportion. Track it as a separate POS code.
Composite Bandra bakery — owner started logging July 2025. Week-1 wastage = 19% (₹2,800/day at cost). Week-12 wastage = 6.5% (₹950/day). Net annualised saving: ~₹6.7L. The change was almost entirely production-sheet trims; ingredient cost % barely moved. The log was the lever; the Sunday review was the act.
What to do this week
Print the wastage log template (linked below — free, no email). Pin it to the production board. The closing baker fills it for 7 days. Sunday evening, sit with the head baker for 30 minutes and update next week's production sheet against the data. That single loop, repeated, is the entire system.
Related on Restaurant Daily
One operator playbook a week, in your inbox.
Cash close, petty cash, payroll, compliance, unit economics — sent every Monday morning. No spam, no upsell drip. Unsubscribe in one click.
Sent from noreply@restaurantdaily.ai. We never share your address.
Related reading
Cloud kitchen daily P&L — single-screen template for Swiggy/Zomato-only brands
Cloud kitchen daily P&L template for Swiggy/Zomato-only Indian brands — aggregator commissions, ad spend, packaging, contribution margin, and the brand-level view that owners actually need.
Menu engineering matrix for Indian restaurants — Stars, Plowhorses, Puzzles, Dogs
Menu engineering for Indian restaurants — Stars, Plowhorses, Puzzles, Dogs explained with a free template, worked example, and an action playbook for each quadrant.
COGS vs prime cost restaurant India — what each tells you and how to track both
COGS vs prime cost for Indian restaurants — what each metric tells you, the formulas, when each one is the right number to act on, and how to track both monthly.
Occupancy cost restaurant India — rent, CAM, electricity benchmarks by city
Occupancy cost in Indian restaurants — rent, CAM, electricity benchmarks by city tier, what to negotiate at lease signing, and how to keep occupancy in the green band.
Restaurant unit economics India — the full guide from prime cost to payback
Restaurant unit economics India — the full guide from prime cost and breakeven to four-wall EBITDA, contribution per cover, and payback period, with worked examples in INR.