Ghost kitchen multi-brand operations — running 5 cloud brands from one kitchen
Ghost kitchen multi-brand operations in India — how to run 5 cloud brands from one kitchen, allocate cost cleanly, prevent SKU collision, and decide when to kill a brand.
Last updated 12 May 2026
About this piece. A ghost kitchen running 5 brands from one physical kitchen is its own operating problem — different from a cloud kitchen running one brand and very different from a multi-outlet restaurant chain. Cost allocation, SKU collision, prep-station conflict, and per-brand contribution accounting all stack on the same square footage. This piece covers how to actually run it: prep-station design, the daily per-brand sheet, the kill-criteria for under-performing brands, and the governance that prevents the kitchen from becoming a multi-brand mess.
What "ghost kitchen multi-brand" actually means
A ghost kitchen — sometimes "dark kitchen" or "virtual restaurant" — is a delivery-only kitchen with no dine-in. Multi-brand means the same kitchen lists on Swiggy and Zomato as 3, 5, sometimes 8 different brands. To the customer, "Mumbai Tandoori" and "Punjabi Tadka" and "Curry Cottage" look like 3 different restaurants. To the operator, they share a kitchen, a head chef, a packaging station, and an electricity bill.
The model exists for one reason: search-listing real estate on aggregators. A kitchen that lists as 5 brands occupies 5 search slots in 5 cuisine categories. The same kitchen, single-brand, occupies one slot in one category.
Public benchmark: NRAI 2024 cloud-kitchen segment data and operator interviews suggest single-brand ghost kitchens average 22–28% net margin in mature operation; well-run multi-brand ghost kitchens reach 28–34% — but poorly-run multi-brand kitchens drop to 8–12% (worse than single-brand) because of cost allocation chaos. Multi-brand done badly is worse than not doing it.
Why most multi-brand ghost kitchens fail at brand 4 or 5
The first 2 brands on a kitchen typically share a cuisine family (e.g. North Indian + Chinese — staples already in mise-en-place). Brand 3 starts adding novel SKUs. Brand 4 introduces ingredient overlap conflicts. Brand 5 needs its own prep station, packaging style, and labels — at which point the kitchen needs governance.
Three failure modes:
- Prep-station collision. Brand A's tandoor time conflicts with Brand B's tandoor time at peak. Both brands' delivery promise slips.
- Packaging mix-up. Brand A's order goes out in Brand C's packaging because the rider's in a hurry. Customer of brand A gets a confused brand experience; chargeback risk.
- Cost allocation ambiguity. Brand A's CM looks great, brand C's looks bad — but the costing model has been allocating shared overhead by order count when it should be by labour-time. Brand A is being subsidised by brand C.
Prep-station design — the physical separation rule
Even in a tight kitchen (~600 sq ft) you need physical separation by station type, not by brand. Brands share stations; stations don't share use-cases:
| Station | Brands using | Capacity gate |
|---|---|---|
| Tandoor | Brand A (North Indian) + Brand C (Mughlai) | 8 orders concurrent |
| Wok | Brand B (Indo-Chinese) + Brand D (Asian fusion) | 6 concurrent |
| Curry stove | Brand A + Brand C + Brand E (Bengali) | 10 concurrent |
| Cold prep | All brands (salads, wraps, desserts) | Continuous |
| Packaging + label | All brands; dedicated brand-coded packaging shelves | 1 packer per 12 orders/hour |
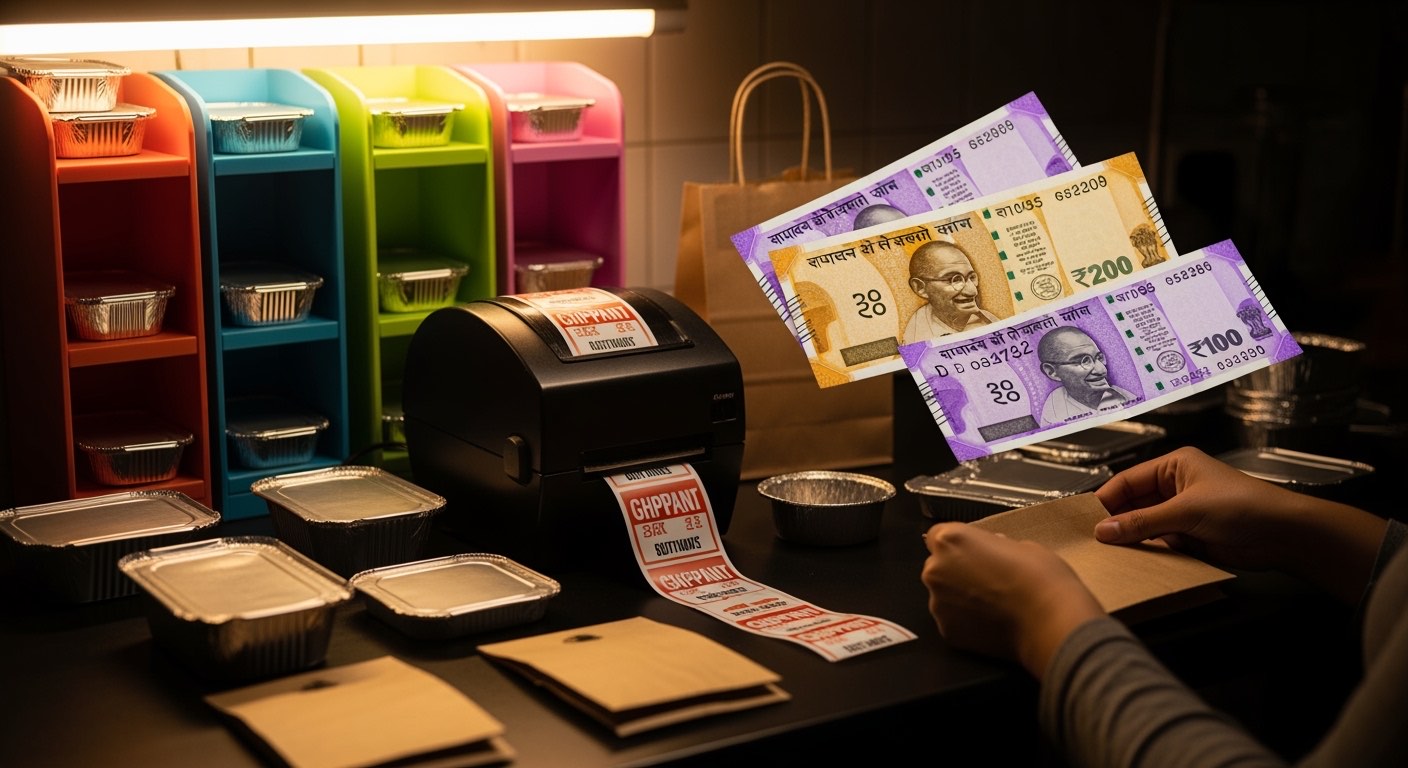
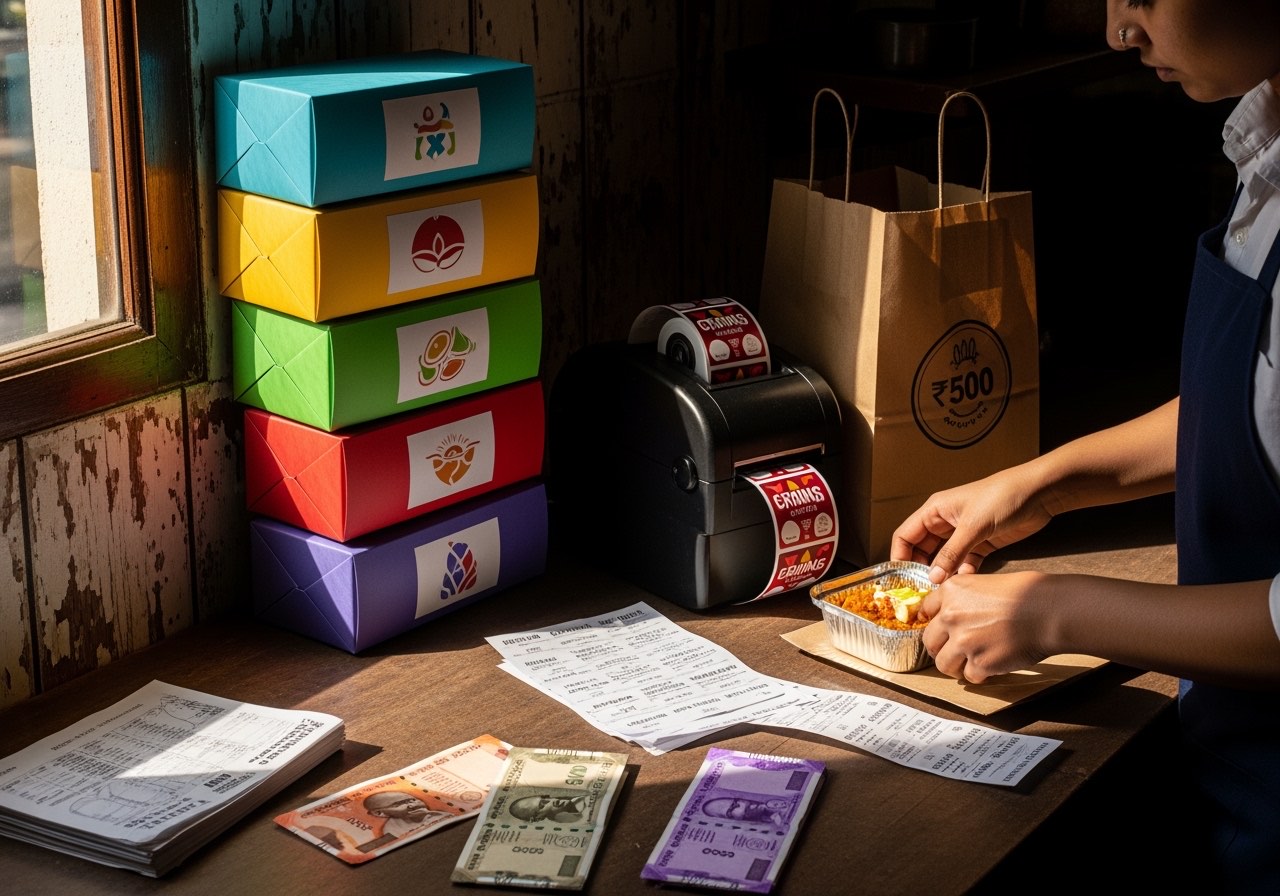
The packaging station is the most brand-sensitive — and the most error-prone. Three rules:
- Per-brand packaging shelves, colour-coded. Brand A = red, Brand B = green, etc.
- Per-brand label printer pre-configured — order ticket prints in the brand's font/logo automatically.
- Order assembly visual: the packer matches order ticket brand → shelf colour → label colour. Three-point match before sealing.
The per-brand daily sheet
Same template as the cloud kitchen daily P&L, one sheet per brand, but with a shared-cost allocation row:
Brand: [BRAND]                                Date: ___ / ___ / ___

REVENUE  (same as cloud kitchen template)
DEDUCTIONS  (commission, ads, discounts)
DIRECT COSTS  (food, packaging, direct kitchen labour)

ALLOCATED SHARED COSTS  ← multi-brand specific
  Rent allocation (by sq ft × time)             ₹ ___
  Utilities allocation (by burner-hours)        ₹ ___
  Shared labour (head chef, packers)            ₹ ___
  Total allocated                               ₹ ___

CONTRIBUTION AFTER ALLOCATION
  CM₹ post-allocation                           ₹ ___
  CM% post-allocation                                ___ %
The post-allocation CM% is the honest number. Before allocation a brand can look great because all the overhead is sitting on the others.
How to allocate shared cost honestly
Three allocation methods, ranked by accuracy:
| Method | Accuracy | Effort | When to use |
|---|---|---|---|
| Order count proportion | Low | Low | Month 1; placeholder |
| GMV proportion | Medium | Low | Quarterly review |
| Time-and-motion proportion | High | High (one-week study) | Annual / when adding/dropping a brand |
A time-and-motion study: for 7 days, log every minute of head-chef + packer time per brand. The proportion is your allocation key for the next quarter. Re-do quarterly.
SKU collision — the menu engineering rule
Multi-brand only works if the menus look different to customers but prep similarly in the kitchen. If brand A and brand C both have "butter chicken" with different recipes, the kitchen has to maintain two recipes, two chicken stocks, two gravies. Cost-of-complexity defeats the brand-real-estate gain.
Rule of thumb: 70% SKU overlap (same kitchen prep, same recipes, just plated/labelled per brand) + 30% brand-distinct hero items. Brand A's hero might be a butter chicken signature; brand B's hero might be a Chinese hakka noodles. Both heroes get menu-position priority on their own brand listing.
If your 5 brands collectively have 180 unique SKUs that all need separate prep, you don't have a multi-brand kitchen — you have a complexity machine eating your margin. Audit SKU overlap quarterly.
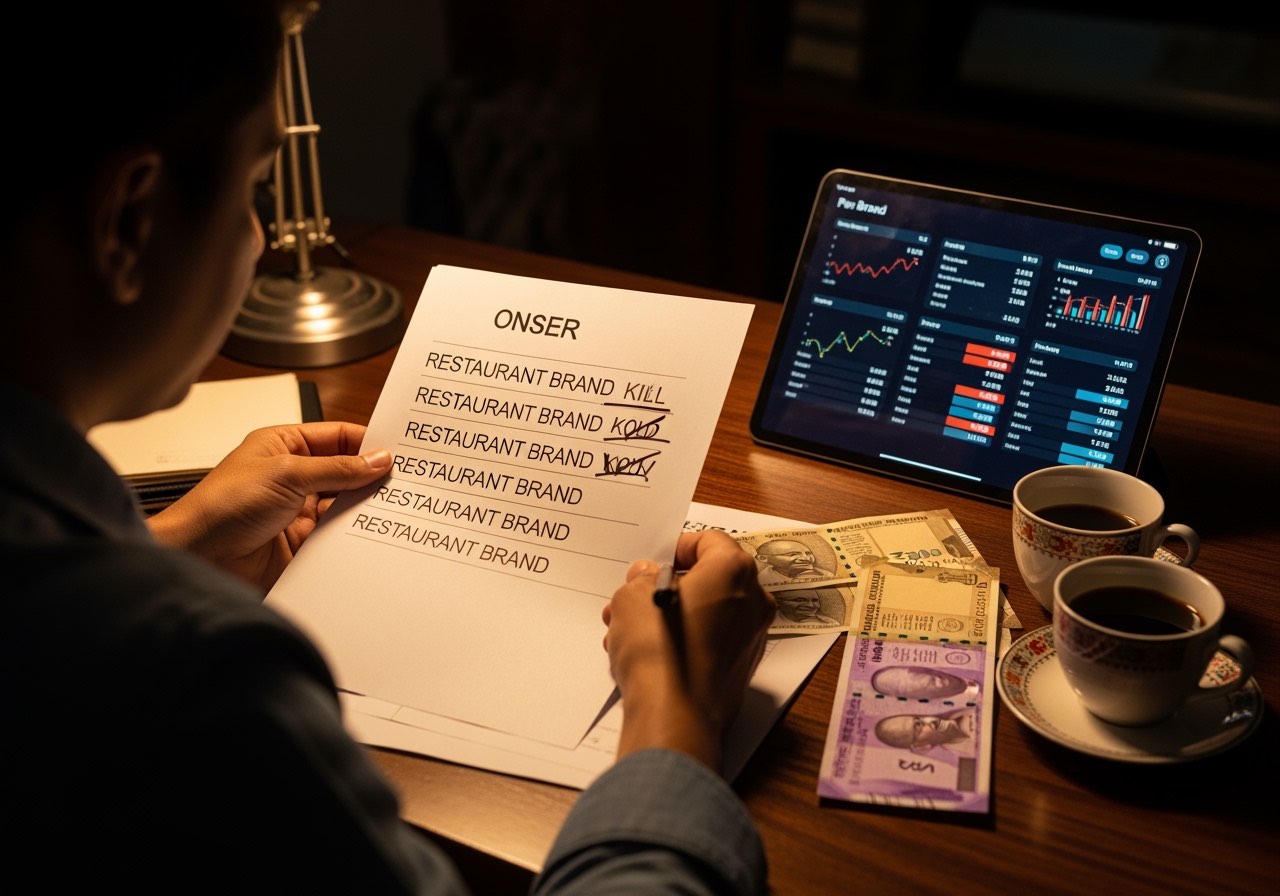
When to kill a brand — the kill criteria
A brand should be killed if any one of the following holds for 8 consecutive weeks:
- Post-allocation CM% < 8% — bleeding even after honest cost allocation
- Order share < 5% of kitchen total — not earning its prep-station footprint
- Customer rating < 3.6 on either Swiggy or Zomato — brand-equity damage that contaminates the kitchen
- Packaging-error rate > 2% of orders — operational signal that the brand doesn't fit the kitchen workflow
Kill = list deactivated, packaging stock cleared, menu archived. Do it cleanly; don't drag the brand for 6 months.
Composite Hyderabad ghost kitchen runs 6 brands as of mid-2026. In Q1 they killed brand #5 (a "healthy bowls" brand) after 11 weeks at post-allocation CM% of 4–6%. The decision freed up 1 prep stove for brand #2 (the kitchen's biryani brand) which then expanded SKU range and grew 22% in the following quarter. Killing brand #5 was a margin event, not a failure.
Daily ops loop for a ghost kitchen — what's different
| Routine | Single-brand cloud kitchen | Multi-brand ghost kitchen |
|---|---|---|
| Daily P&L | One sheet | One per brand + roll-up |
| Cash close | Tiny (no walk-in) | Tiny |
| Imprest float | ₹500–₹1,000 | ₹500–₹1,000 |
| Packaging audit | Weekly | Daily (error rate by brand) |
| Aggregator reconciliation | Weekly | Weekly per brand |
| Brand kill review | N/A | Quarterly across all brands |
| Time-and-motion study | N/A | Annual + on brand add/drop |
The cash discipline is light; the data discipline is heavy. The opposite of a dine-in restaurant.
Three governance rules
1. Brand owner = one person, even if you operate it yourself
Each brand needs a single accountable person — even if you the operator wear all 5 brand-owner hats. The brand owner is responsible for menu, ratings, ad spend, and the per-brand P&L. Without naming, accountability dissolves across 5 brands.
2. Quarterly brand-portfolio review
Once a quarter — first Saturday — sit with the per-brand P&L for all brands. Ask: kill, hold, grow, launch. One decision per brand. No more than 1 launch per quarter (capacity discipline).
3. Aggregator listing hygiene
Each brand's Swiggy + Zomato listing has 8 elements that drift: menu prices, item images, descriptions, opening hours, delivery radius, store status, ad bids, promotion stack. Per brand × 2 aggregators × 8 elements = 80 things. Quarterly listing audit, per brand. Otherwise prices and images go stale and customer experience degrades silently.
What to do this week
If you're running 4+ brands without per-brand post-allocation CM%: do a one-week time-and-motion log on head chef + packer time. Allocate this week's shared cost using the new key. The post-allocation CM% per brand will surprise you — almost always one brand looks much better and one much worse than you assumed. That's the start of honest portfolio decision-making.
Related on Restaurant Daily
One operator playbook a week, in your inbox.
Cash close, petty cash, payroll, compliance, unit economics — sent every Monday morning. No spam, no upsell drip. Unsubscribe in one click.
Sent from noreply@restaurantdaily.ai. We never share your address.
Related reading
Catering business daily tracking — event-day template covering food, staff, payments
Catering business daily tracking template for Indian caterers — event-day sheet covering food prep, staff deployment, payment milestones, and the four leakage points unique to catering.
Central kitchen vs distributed kitchen for Indian restaurant chains
Central kitchen vs distributed: cost, ops, quality trade-offs for Indian restaurant chains. Break-even outlet count, FSSAI implications, and the IST overhead nobody prices in.
How to manage multiple restaurant outlets — a week-by-week operating rhythm
How to manage multiple restaurant outlets — the area manager's week-by-week operating rhythm, daily/weekly/monthly cadence, and the four habits that keep quality even.
Multi-outlet restaurant management in India — what changes between 1 and 5
Multi-outlet restaurant management in India — what changes between 1 outlet and 5, the four operating phases, role structure, and the cost of getting it wrong.
Tier-2 Indian city restaurant daily ops — what changes vs metro (staffing, supply, margins)
Tier-2 Indian city restaurant daily ops vs metro — what changes in staffing, supply chain reliability, ticket size, and margins. Operator-grade comparison and adjustments.